
Editor’s Note: Astrobites is a graduate-student-run organization that digests astrophysical literature for undergraduate students. As part of the partnership between the AAS and astrobites, we occasionally repost astrobites content here at AAS Nova. We hope you enjoy this post from astrobites; the original can be viewed at astrobites.org.
Title: Tracing the Top-of-the-Atmosphere and Vertical Cloud Structure of a Fast-Rotating Late T-dwarf
Authors: Elena Manjavacas et al.
First Author’s Institution: Space Telescope Science Institute and Johns Hopkins University
Status: Published in AJ
While they have a reputation as “failed stars,” brown dwarfs might have more in common with their gas giant planet cousins than with stars. Brown dwarfs have swirling, patchy clouds in their atmospheres, and the light curves of brown dwarfs have been seen to vary in amplitude as they rotate and bring different faces with variable cloud coverage into view. By observing brown dwarfs over their rotation periods with spectrophotometry, astronomers can simultaneously measure how much the atmosphere is changing in multiple wavelength bands. This technique means a 3D map of a brown dwarf’s atmosphere can be built, since different wavelengths probe different levels of pressure within an atmosphere. Although most spectrophotometric observations of brown dwarfs have used the Hubble Space Telescope, the authors of today’s article employed the ground-based Keck I telescope to study 2M0050–3322, a rapidly rotating T-type brown dwarf.
Seeing One Atmosphere Through Another
Since the levels of variability in brown dwarf atmospheres can be small, it is important to characterise any other non-brown dwarf sources of noise in the data. For these ground-based observations, particular care has to be taken to account for changes in Earth’s atmosphere over the course of the observations. Using the Multi-Object Spectrometer For Infra-Red Exploration (MOSFIRE), the authors observed 2M0050–3322 for two of its rotation periods (around 2.5 hours in total). They also observed several other nearby stars to help calibrate the impacts of things like the local humidity and temperature on the measurements. The light curves of all the objects were obtained at multiple different infrared wavelengths: J band, H band, and in a wavelength range slightly redder than the H band, which the authors call the CH–H2O band. By dividing each of 2M0050–3322’s light curves by the median light curve of the calibration stars, 2M0050–3322’s light curves could be corrected for any effects of Earth’s changing atmosphere to find the true variability of the brown dwarf, as shown in Figure 1.
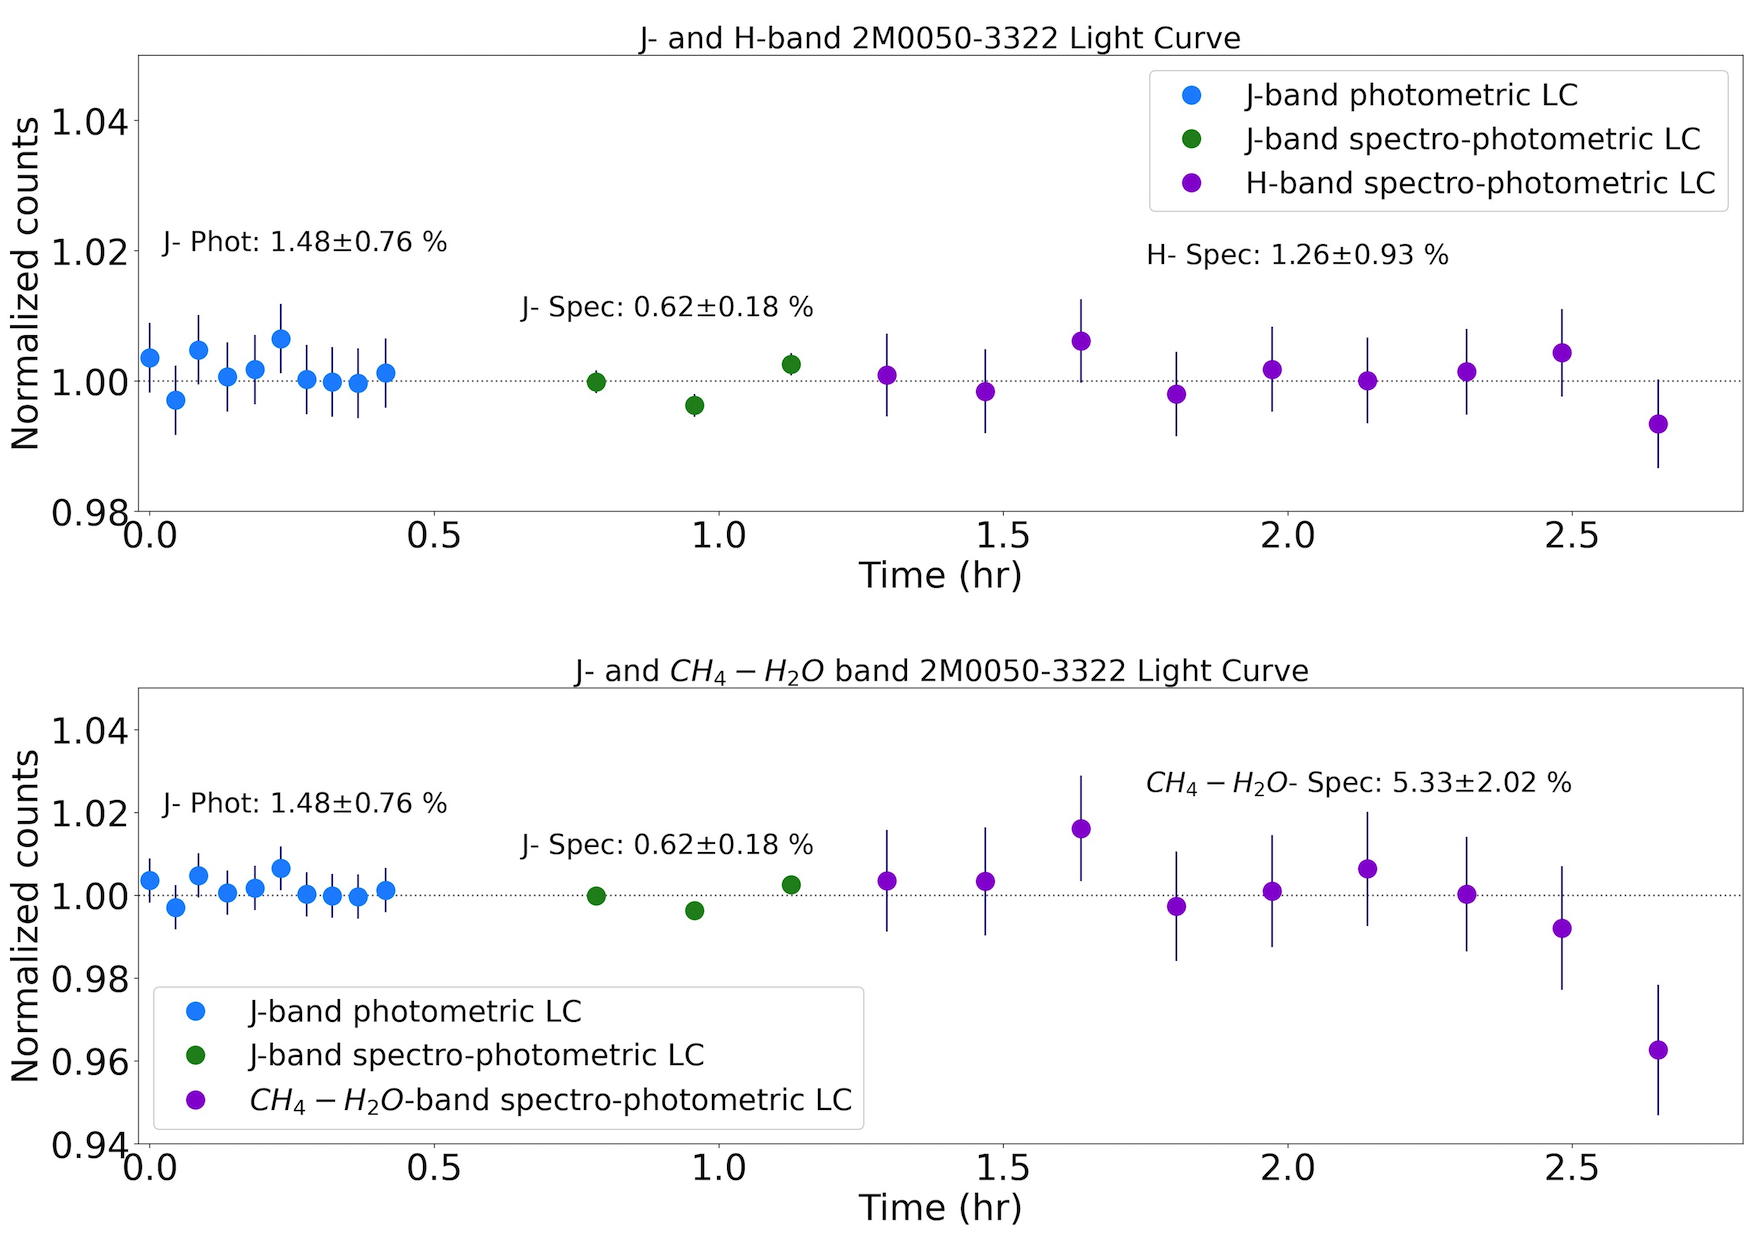
Figure 1: Light curves of 2M0050–3322 in J, H and CH4–H2O bands. The CH4–H2O band shows the biggest fluctuations, but all bands are best fit by a flat line. [Manjavacas et al. 2022]
Models to the Rescue?
With observations in hand, the authors then sought to compare their results to models of 2M0050–3322 to see if a similar lack of variation was present. General circulation models of the thermal flux of the atmosphere predict a slightly sinusoidal light curve with almost a 1% variation, which matches the amplitude seen in the J and H band observations! Meanwhile, models of the structure of clouds in the atmosphere show that 2M0050–3322 has various types of clouds at different pressures, meaning that each of the observation bands could be probing different clouds.
Figure 2 shows that the CH4–H2O band traces similar pressure levels as those where sodium sulphide (Na2S) and potassium chloride (KCl) clouds condense. This could explain why the CH4–H2O light curves show more variability than the other bands, which reach deeper into the atmosphere and therefore do not probe these clouds. While these modelling efforts begin to explain the observations of the brown dwarf, the authors caution that longer-term monitoring is likely needed to fully explain the mysteries of 2M0050–3322.
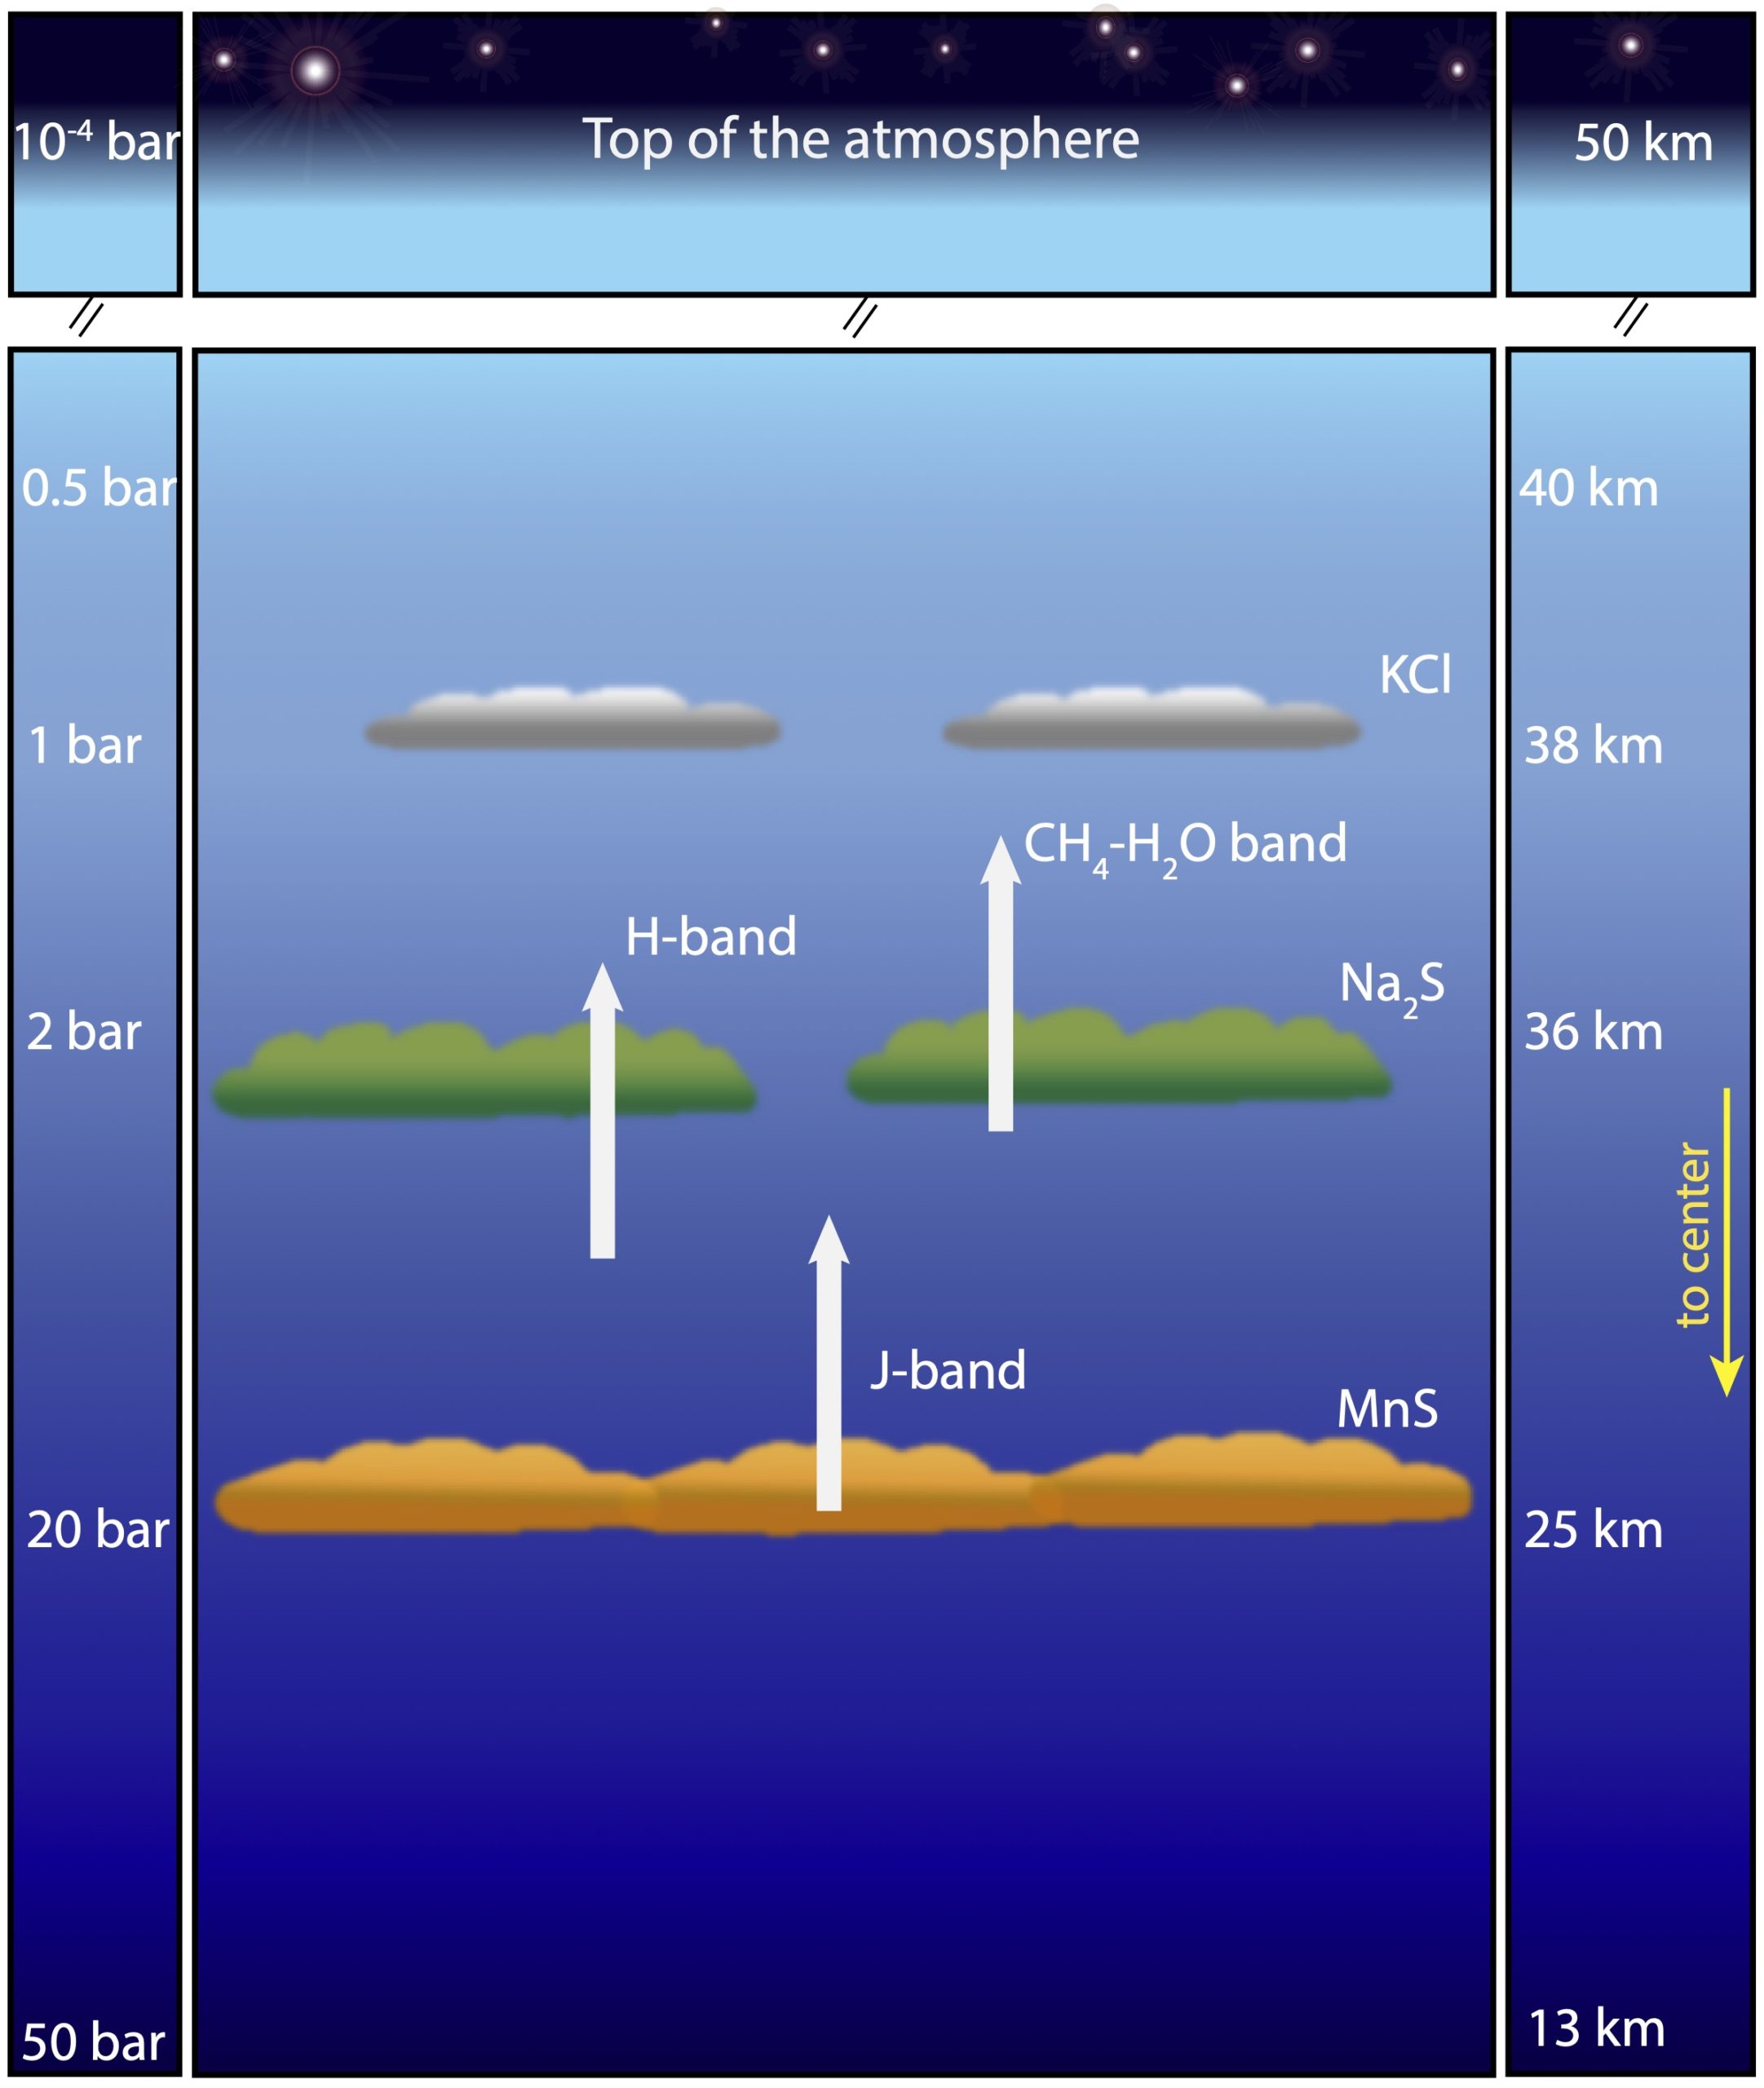
Figure 2: Visual representation of the cloud structure of 2M0050–3322. Three types of clouds are seen to form in the atmosphere, each at different pressure levels. KCl and Na2S clouds are seen to form at similar pressure levels as those probed by the CH4–H2O band, possibly explaining why this band shows more variation than the J and H bands. [Manjavacas et al. 2022]
About the author, Lili Alderson:
Lili Alderson is a second-year PhD student at the University of Bristol studying exoplanet atmospheres with space-based telescopes. She spent her undergrad at the University of Southampton with a year in research at the Center for Astrophysics | Harvard-Smithsonian. When not thinking about exoplanets, Lili enjoys ballet, film, and baking.